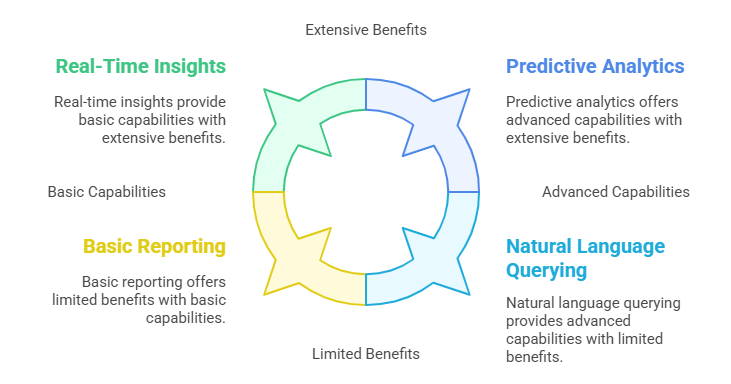
Analytics and reporting tools empower businesses to gather, process, and visualize data from various sources, enabling informed and strategic decision-making. Over time, these tools have advanced significantly, now offering capabilities like data mining, dynamic visualizations, performance tracking, natural language querying, and predictive analytics. They deliver key benefits such as real-time insights into organizational performance, quick detection of irregularities for faster response, and forecasting tools to anticipate sales trends and future outcomes. In this blog we are discussing the top & best reporting and analytics tools along with their key features for better decision making.

Best Reporting and Analytics Tools
Microsoft Power BI
Power BI is a powerful reporting and analytics tool developed by Microsoft. Power BI helps transform raw datasets into clear insights by creating interactive dashboards and detailed reports. It is widely recognized for its strengths in data visualization, analytics, and reporting. Businesses that operate within the Microsoft environment often prefer Power BI due to its seamless integration with ERP & other tools.
Key Features
- Visual Analytics: Power BI lets users build data visuals such as charts, graphs, maps, and tables using a simple drag and drop interface.
- Data Preparation: Power Query supports cleaning, shaping, and transforming data before it is analyzed.
- Collaboration and Sharing: Reports can be shared with others, and users can leave comments on specific data points to support teamwork.
- Integration: Power BI supports connections to multiple Microsoft data sources, allowing users to bring data together for comprehensive analysis.
- Custom Visuals: Users have the flexibility to design and implement personalized visuals in addition to the built-in options.
SAP Business Object
SAP BusinessObjects, also known as SAP BO or BusinessObjects, is a comprehensive business intelligence software suite developed by SAP. It provides robust tools for reporting and data visualization, enabling professionals to gather, analyze, and explore business data effectively.
Key Features
- Reporting and Analysis: Generate reports and analytical dashboards to extract meaningful insights from your data.
- Collaboration and Sharing: Share dashboards and reports with team members to support collaborative decision-making.
- Role-Based Dashboards: Deliver tailored insights to specific users through dashboards customized by role or department.
- Real-Time Analytics: Integrates with SAP Business Warehouse and SAP HANA to provide up-to-date analytical insights.
- Dashboard Design: Build interactive dashboards with customizable visual elements and a variety of display options.
Tableau
Tableau, developed by Salesforce, is a business intelligence and data visualization platform that enables analysts to explore, visualize, and understand their data to support informed decision-making. It helps turn raw data into clear, actionable insights. Tableau offers features such as seamless data connectivity, drag-and-drop visual creation, advanced analytics, and the ability to build interactive reports and dashboards. If you’d like to see how it compares with Microsoft’s solution, such as Power BI, read our detailed guide on Power BI vs Tableau.
Key Features
- Data Connectivity: Easily integrates with multiple data sources, including databases, spreadsheets, and cloud-based platforms.
- Advanced Analytics: Supports complex calculations, statistical evaluations, and predictive modeling.
- Collaboration and Sharing: Enables users to share dashboards, reports, and visualizations with teams or stakeholders.
- Trend and Forecasting Tools: Identifies data patterns and provides forecasts to support forward-looking decisions.
- Tableau Prep: Offers built-in tools to clean, shape, and organize data for smoother analysis workflows.
Looker
Looker is a leading reporting and analytics tools known for its robust semantic layer, which enables users to build a well-structured representation of their data. This layer defines how data elements relate to each other, including metrics and dimensions, simplifying complex data modeling. Looker’s approach makes data more accessible and understandable, empowering both technical teams and business users to explore, analyze, and gain insights with ease.
Key Features
- Data Exploration: Build tailored reports and interactive visualizations to uncover insights from your data.
- Embedded Analytics: Integrate Looker dashboards and reports directly into websites, applications, or business workflows.
- Collaborative Analysis: Facilitates teamwork by allowing users to share dashboards, data models, and reports.
- Google Workspace Integration: Seamlessly connects visual data insights with tools like Google Slides and Sheets.
- LookML: Uses a proprietary modeling language that helps define metrics, dimensions, and relationships within your data.
Sisense
Sisense is a business intelligence platform that allows organizations to connect to multiple data sources and build interactive dashboards and visualizations. It includes features such as data blending, modeling, and advanced visualization tools. Sisense also supports complex analytics and predictive modeling, enabling deeper data insights. Additionally, it can be embedded into existing applications and web platforms, allowing seamless integration without interrupting current workflows.
Key Features
- Visual Dashboards: Build dashboards, filters, and widgets with a user-friendly drag-and-drop interface.
- Data Modeling: Combine and structure data using a code-first approach directly within the platform.
- Version Control: Git integration allows for efficient tracking and management of changes.
- Mobile Accessibility: Provides mobile apps for both iOS and Android, enabling data access from anywhere.
- Custom Widgets: Design and personalize widgets to create more interactive and tailored dashboard experiences.
DOMO
Domo is a business intelligence solution that helps organizations gather, analyze, and visualize data from diverse sources. Widely used across industries, it supports data-driven decision-making and enhances operational performance. With its user-friendly design, Domo caters to both technical and non-technical users, providing a comprehensive set of tools to simplify data management and interpretation.
Key Features
- Dashboards and Reporting: Provides flexible reporting tools with a drag-and-drop interface for quick analysis and content creation.
- Mobile Support: Fully compatible with iOS and Android apps, enabling on-the-go access for all users.
- Collaboration Tools: Facilitates teamwork through features like built-in chat, user profiles, task tracking, project management, and scheduled reports.
- Cloud-Based Architecture: Built on a cloud-native platform that supports dynamic scaling and high-performance parallel processing.
- Data Governance: Includes robust capabilities for ensuring data quality, enforcing security policies, and maintaining compliance.
QlikSense
Qlik Sense is an impressive data reporting and analytics tool designed to support a wide range of use cases, including interactive dashboards, customized analytics, and embedded solutions. It offers deployment flexibility, allowing organizations to run it either on-premises or in the cloud, depending on their infrastructure and preferences.
Key Features
- Interactive Visualizations: Design dynamic visuals like charts, tables, and graphs to explore data in a meaningful way.
- Associative Data Engine: Leverage Qlik’s unique associative model to uncover hidden data connections and insights.
- Machine Learning Integration: Conduct machine learning experiments within Qlik Cloud Analytics and apply results directly to data models.
- Storytelling with Data: Create and share compelling data stories that blend visual elements with context-rich narratives.
- Augmented Analytics: Enhance decision-making with built-in AI and machine learning tools that guide analysis and uncover deeper insights.
Yellowfin
Yellowfin is a business intelligence and analytics platform that offers tools for reporting, data visualization, and in-depth analysis. It stands out by integrating enterprise-grade dashboards with collaborative functionality. Yellowfin enables users to build custom visualizations, produce detailed reports, and uncover patterns or anomalies within datasets.
Key Features
- Interactive Visuals: Delivers dynamic dashboards and visual tools for exploring and sharing data insights.
- Collaborative Analytics: Enables teams to work together by sharing reports, dashboards, and findings directly within the platform.
- Automated Insights: Automatically detects and highlights important trends, patterns, and anomalies in your data.
- Data Storytelling: Includes tools for creating and presenting compelling, narrative-based data stories.
- Data Connectivity: Integrates with multiple data sources to unify and analyze data from various platforms.
ThoughtSpot
ThoughtSpot offers a comprehensive business intelligence platform that enables users to ask questions and analyze data within their existing workflows.
With Spotter, the built-in AI analyst, users can ask questions in natural language and receive quick answers along with relevant visualizations.
For tasks such as performance comparisons or trend forecasting, ThoughtSpot provides timely and contextual insights. Additionally, data teams can use Analyst Studio for more advanced calculations and data modeling to gain deeper insights
Key Features
- AI-powered self-service analytics: Spotter lets users explore data using natural language, ask follow-up questions, and share insights across teams easily.
- Conversational experience: The intuitive interface enables business users to interact with AI-generated answers and dive deeper into the data as needed.
- Interactive visualizations with Liveboards: Create real-time visualizations, apply filters, and drill down into cloud data to track performance or present insights effectively.
- Augmented analytics with SpotIQ: Go beyond basic analysis by identifying hidden trends, anomalies, and receiving AI-driven suggestions for next steps like forecasting or issue detection.
Oracle Analytics Cloud
Oracle Cloud Analytics is a cloud-based reporting and analytics tool designed to work seamlessly within the Oracle ecosystem. It provides features for data visualization, reporting, and augmented analytics, enabling users to analyze data from multiple sources. The platform supports organizations in enhancing their data-driven decision-making and overall analytical performance.
Key Features
- Data Preparation: Offers capabilities to cleanse, transform, and enhance data prior to analysis.
- Advanced Analytics: Enables predictive modeling and machine learning for deeper insights and trend forecasting.
- Interactive Visualizations: Translates data into engaging dashboards and visuals for clearer understanding.
- Collaborative Tools: Facilitates organization-wide collaboration through shared reports and analytics projects.
- Oracle Integration: Works smoothly with other Oracle services and cloud-based data sources for unified analysis.
Wrapping Up…
Selecting the right reporting and analytics tool is essential for maximizing the value of your data. The tools covered in this guide provide distinct features suited to various business needs. As you explore different tools, prioritize your team’s technical capabilities, available budget, future growth plans, and integration demands.
Choosing the right solution will help drive smarter decisions, enhance efficiency, and strengthen your competitive position. If you’re unsure where to begin, feel free to contact us to help identify the best solution for your specific needs. Also, we are providing FREE Power BI assessment to help you in better decision making. The true value of data lies in how effectively it’s analyzed and applied to drive meaningful outcomes.
FAQs
Reporting tools enable businesses to analyze their operations more effectively by highlighting key trends, potential opportunities, and emerging challenges. This data-driven approach supports strategic planning and enhances overall business performance.
Power BI is one of the most widely used reporting tools globally, known for its intuitive interface, real-time dashboards, and seamless integration with various data sources. It empowers businesses of all sizes to turn raw data into actionable insights with ease.
Data analytics tools support businesses by enabling timely decision-making, offering clear data visualizations, ensuring greater accuracy, automating routine processes, and uncovering hidden trends using AI and machine learning.
Claim your FREE Microsoft Power BI assessment today!


